Guides

Carla Penn-Kahn

Most paid media teams optimise for ROAS. The best ones optimise for which products are in the mix in the first place, and then set ROAS targets based on what each product deserves.
THE PROBLEM: WHY MOST AD ACCOUNTS ARE OPTIMISING FOR THE WRONG THING
Your campaign is only as good as its product selection
Here is the uncomfortable truth about most DTC Google Shopping accounts: the algorithm is optimising hard for something, just not necessarily the right thing. It's pushing budget toward whatever converts, and products that convert aren't always the products you should be scaling. Some are heavy discounters. Some have broken size curves. Some are running out of stock. Some are high-volume but razor-thin margin.
Performance managers who only look at ROAS, CPA, and conversion rate are working with an incomplete picture. They're optimising the engine without ever questioning the fuel.
The ones who close the gap, consistently across clients, and do something different. They connect product data to campaign structure before they touch a bid.
“Connecting product data, sessions, creative performance, and revenue signals, ensuring no product is left behind and ad spend drives real movement.”
THE FRAMEWORK: HOW TO BAND YOUR PRODUCTS AND BUILD AROUND THEM
Why your product mix matters more than your bids
One of the most powerful tools available to a DTC performance manager isn’t a bidding algorithm or a creative testing framework. It’s product banding, a structured classification of every SKU in the catalogue based on its contribution to revenue or profit.
The approach works like this. Every product gets assigned to one of four tiers:
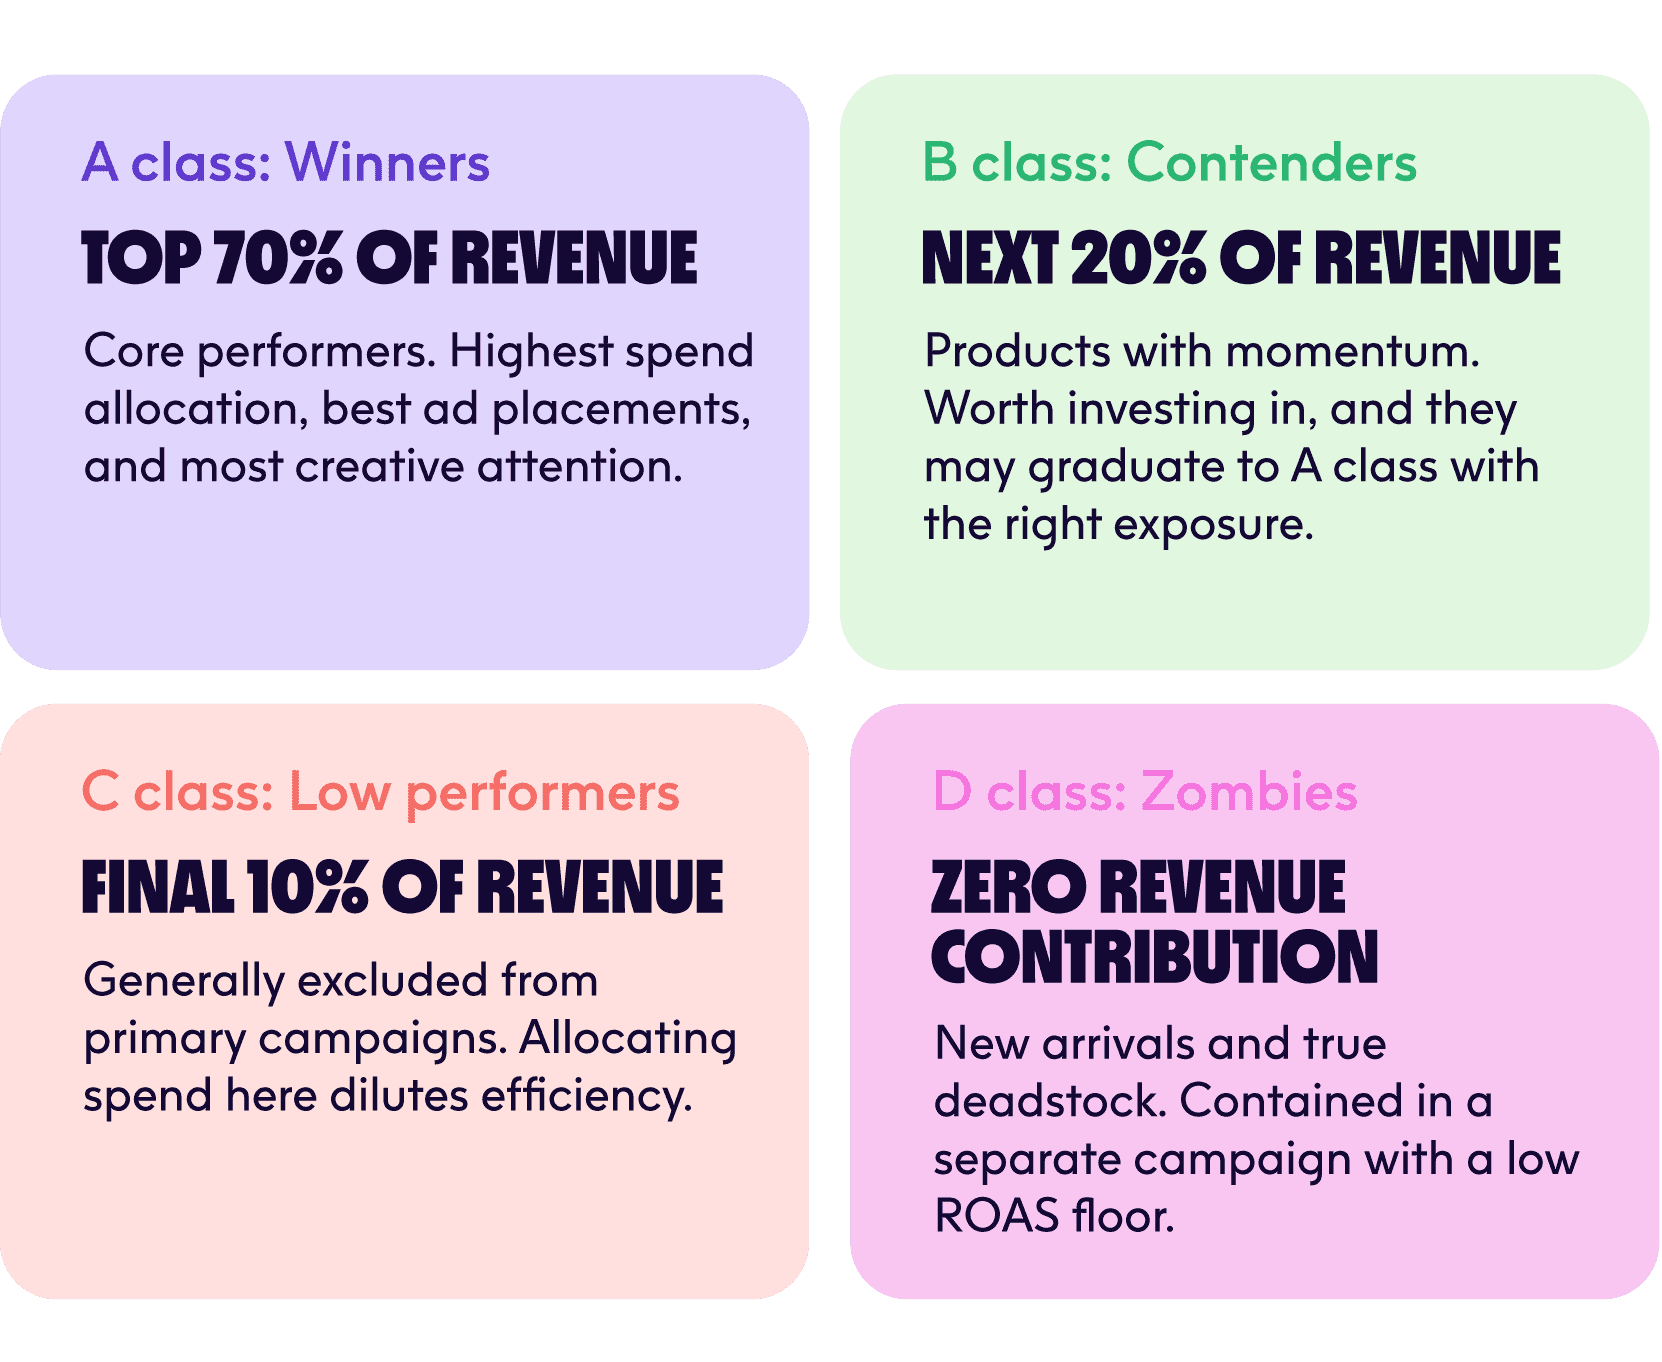
Critically, the percentage splits are adjustable. Some brands run tighter A classes. Others give more room to B. The specific thresholds matter less than the discipline of having them at all.
And one key decision comes before any of this: are you banding by net sales or by profit? The answer shapes everything. Profit-led banding surfaces your most financially valuable products. Net sales banding captures volume, which may include strong performers with lower margins. Neither is wrong. But you have to choose deliberately, not by default.
THE STRUCTURE: A CAMPAIGN ARCHITECTURE THAT REFLECTS PRODUCT REALITY
How to set ROAS targets by product tier
Once the bands exist, the campaign structure follows logically. Each campaign targets a specific product tier at a ROAS that reflects its profitability profile. Two price states matter here: FP (full price, products selling at full retail) and SP (sale price, products currently on promotion or markdown). Separating these prevents discounted inventory from dragging down ROAS targets set for full-margin products.
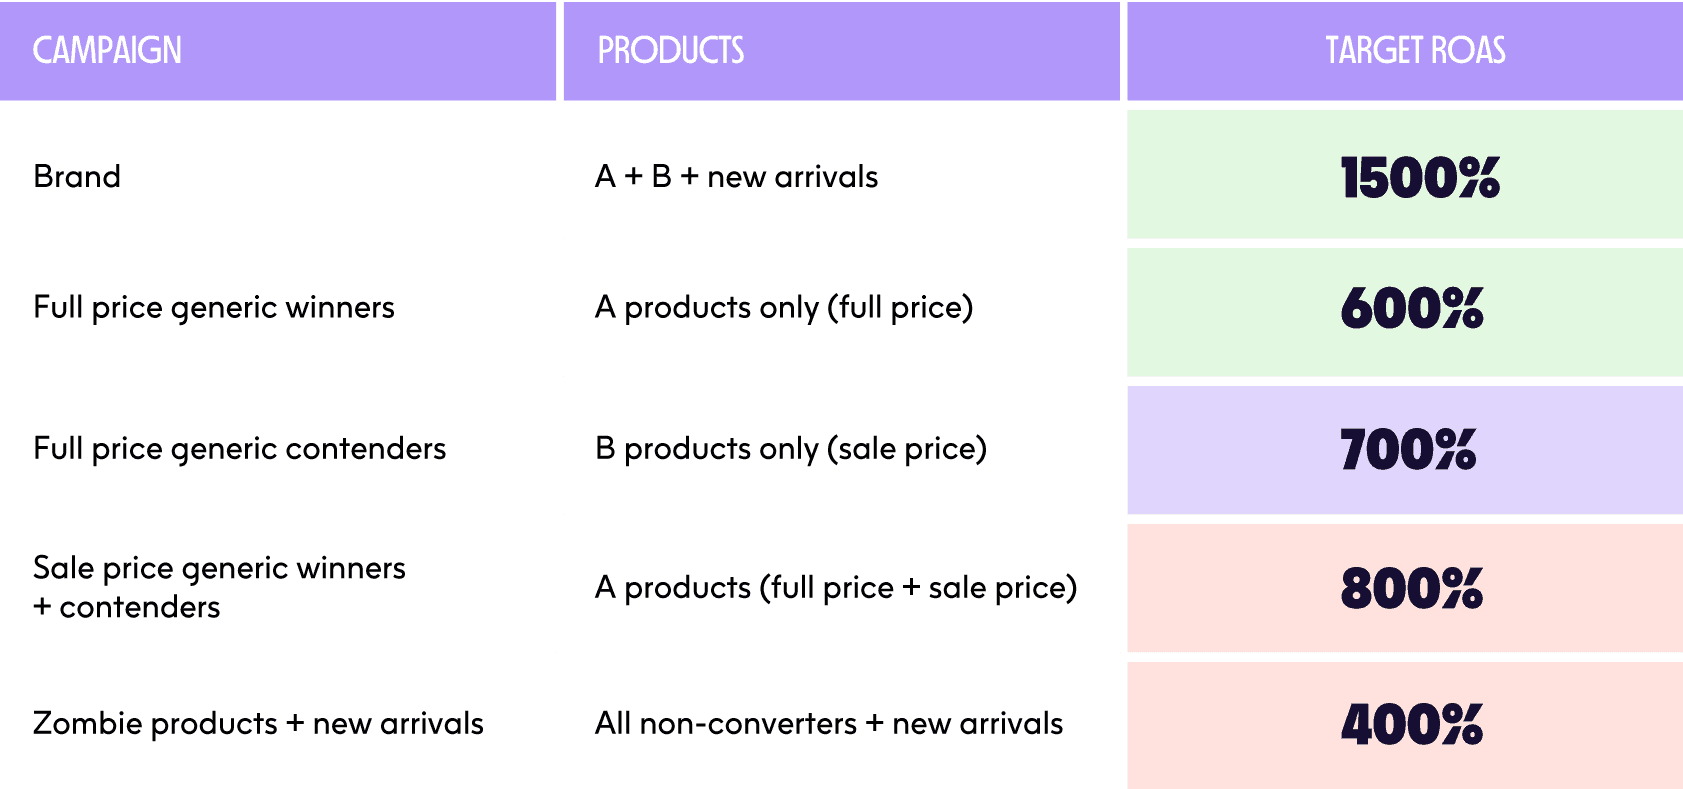
The logic behind the ROAS targets is deliberate: the higher the profit performance of a product, the lower the ROAS target you can justify, because you’re prioritising volume over pure efficiency. The inverse applies to sale price or lower-tier products where margin compression is already a reality.
THE PIPELINE: CONNECTING PRODUCT DATA TO CAMPAIGN DECISIONS
The live data pipeline behind a merchandised ad mix
Merchandising the ad mix isn’t a one-time setup. It’s a live system, one where product signals flow continuously into campaign decisions. The data pipeline that enables this connects five domains:
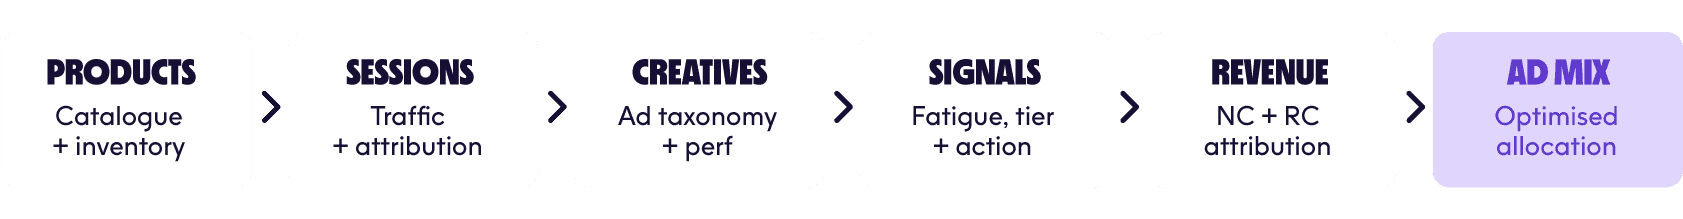
When this pipeline is working, you stop discovering problems after the fact. You don’t find out a product broke its size curve after it’s burned significant spend. You don’t discover a new arrival had zero creative coverage after it’s already been marked down. The system surfaces those gaps before they become decisions you can’t undo.
THE IMPLEMENTATION: HOW TO BUILD THIS IN PRACTICE
How to implement product banding in five steps
In practice, the process follows five steps that span the brand and the performance team:
Step 1: Agree on the banding metric
Before any tags are created, the brand decides whether they’re banding by net sales or by profit. This isn’t a technical choice, it’s a commercial one. A brand with strong volume but thinner margins may want to lead with profit. One that needs cash flow may prioritise sales velocity. The performance manager’s job here is to surface the trade-offs, not make the call for them.
Step 2: Create the tags
This is where most teams get stuck. Building and maintaining metafield tags manually is time-consuming, error-prone, and often the first thing that gets deprioritised when a team is stretched. ProfitPeak removes this friction entirely.
ProfitPeak automatically generates and applies all product metafield tags directly to your Shopify catalogue. Once connected, the platform reads your revenue and profit data, calculates each product’s band classification, and writes the tags to your store without any manual intervention. There are no spreadsheets to update, no feeds to re-export, and no risk of a campaign running against stale classifications.
Critically, the tags update automatically on a continuous basis. As products sell, as new arrivals land, and as revenue contribution shifts across the catalogue, ProfitPeak recalculates the bands and rewrites the metafields accordingly. A product that graduates from D class to B class as it finds its audience will have its tag updated without anyone lifting a finger, and the campaign structure will reflect that change at the next feed refresh. The goal is a live, accurate feed that always reflects commercial reality, not a snapshot that starts degrading the moment it’s exported.
What makes ProfitPeak’s tagging genuinely different is the depth of signal it draws on. Banding a product isn’t just a revenue calculation, it’s a composite read of every commercial dimension that affects whether that product deserves spend. ProfitPeak ingests and weighs nine distinct data layers when generating and updating metafield tags:
Conversion rate: how effectively each product converts the traffic it receives, distinguishing genuine demand from volume inflated by discounting.
Sessions: the volume of traffic arriving at each product page, revealing whether low revenue reflects weak demand or simply insufficient exposure.
Creative performance: which ads are actively driving traffic to each product, and how those creatives are performing, so coverage gaps and fatigue show up at the product level, not just the campaign level.
Multi-touch attribution: a full-funnel view of the channels and touchpoints that contributed to each sale, so banding decisions aren’t skewed by last-click bias or channel siloes.
Stock on hand: live inventory levels per SKU, so budget is never being scaled into products that are about to go out of stock or are already constrained at key sizes.
Return rates: products with high return rates can inflate revenue figures while destroying contribution margin. ProfitPeak factors this in so high-return SKUs don’t get promoted as winners when the net economics tell a different story.
Size curve availability: a product with only fringe sizes remaining is not the same commercial opportunity as one with full size depth. ProfitPeak reads availability at the size level so spend isn’t scaled into a broken curve that will convert poorly and frustrate customers.
Sell-through rate: the pace at which inventory is being sold relative to what was received, giving a forward-looking signal about whether a product needs more exposure or is already clearing at a healthy rate.
Weeks of cover: how many weeks of stock remain at the current rate of sale. A product with two weeks of cover should not be treated the same as one with twelve, even if their revenue bands are identical. ProfitPeak uses this signal to flag products approaching stock-out and prevent spend from accelerating into a dead end.
No other platform in the market combines all nine of these signals into a single, automatically maintained metafield tag layer. Most tools give you revenue. Some add inventory. ProfitPeak gives you the complete commercial picture, kept current without any manual upkeep.
Step 3: Brand review
Before anything goes live, the brand reviews each band. Product numbers per tier should feel right, not so many A class products that the concept dilutes, not so few that volume becomes a problem. Anomalies get flagged and adjusted.
Step 4: Push through to campaigns
Once approved, the tags flow into the campaign feed, typically through a feed management platform and into Google. Campaign structure is updated to reflect the banding logic.
Step 5: Monitor continuously with Sherpa
This is where most implementations fail: the setup is solid, but ongoing monitoring reverts to manual gut-checks and weekly reporting decks. The best performance managers close this loop using ProfitPeak’s AI agent, Sherpa.
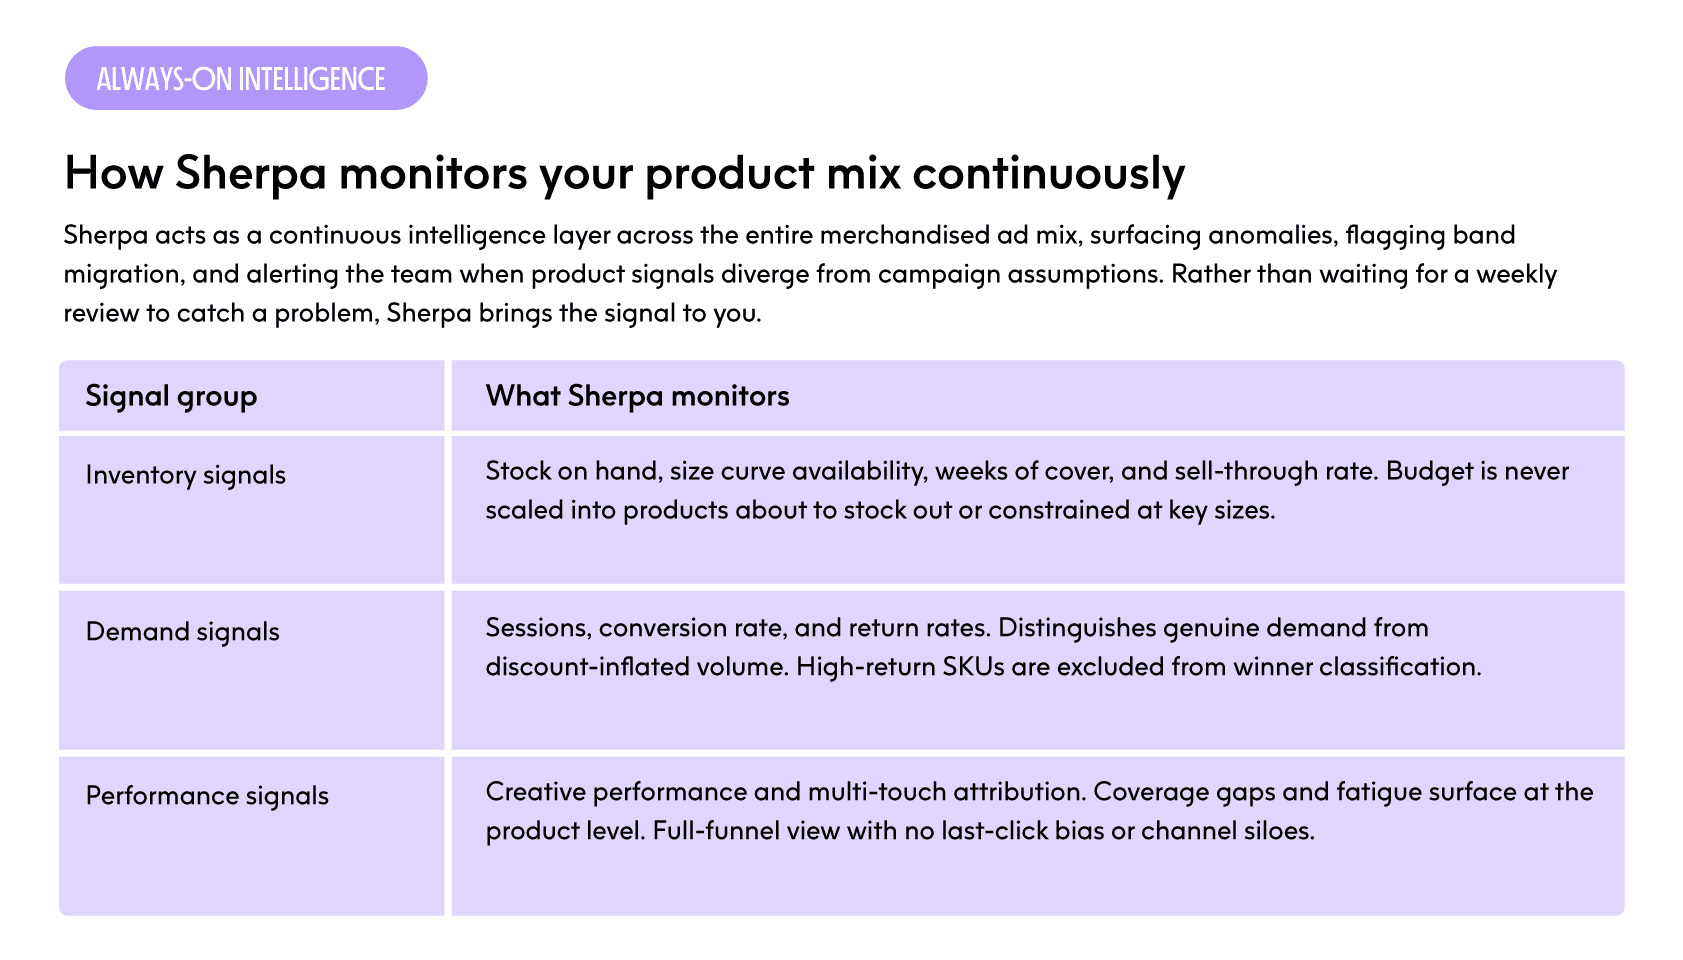
The bands are not static. Products move between tiers as their revenue contribution changes, and when they do, the campaign structure needs to reflect it. Sherpa makes this a proactive process rather than a reactive one.
The real edge isn't in the platform
The performance managers closing the gap between efficient spend and profitable growth aren't doing it with better bidding strategies or more advanced audience segmentation. They're doing it by insisting on a clear picture of what's in the ad mix before any of that work begins, and keeping that picture accurate as the catalogue evolves. Product data is performance data. Sherpa makes sure you never lose sight of either.
Net sales or profit banding: which to choose
The right answer depends on where the brand is in its data journey. For brands with clean margin data across their catalogue, profit-led banding is the stronger starting point. It surfaces your most commercially valuable products and prevents volume winners with thin margins from consuming budget they don’t deserve. For brands earlier in the process, or where margin data is incomplete, net sales banding is a practical and defensible starting point. The discipline of banding matters more than the metric you start with. Most brands that begin with net sales migrate toward profit banding as their data matures. ProfitPeak supports both.
See it in practice
Pace Athletic used ProfitPeak’s product tagging to dynamically move products into the right campaigns at the right time, delivering a 79% increase in total gross profit and a 30.5% lift in Klaviyo metric revenue. Read the full case study.
Carla Penn-Kahn
CEO & Co-Founder
Carla spent over a decade building and successfully exiting several e-commerce brands, following an earlier career in corporate advisory and investment at Credit Suisse.